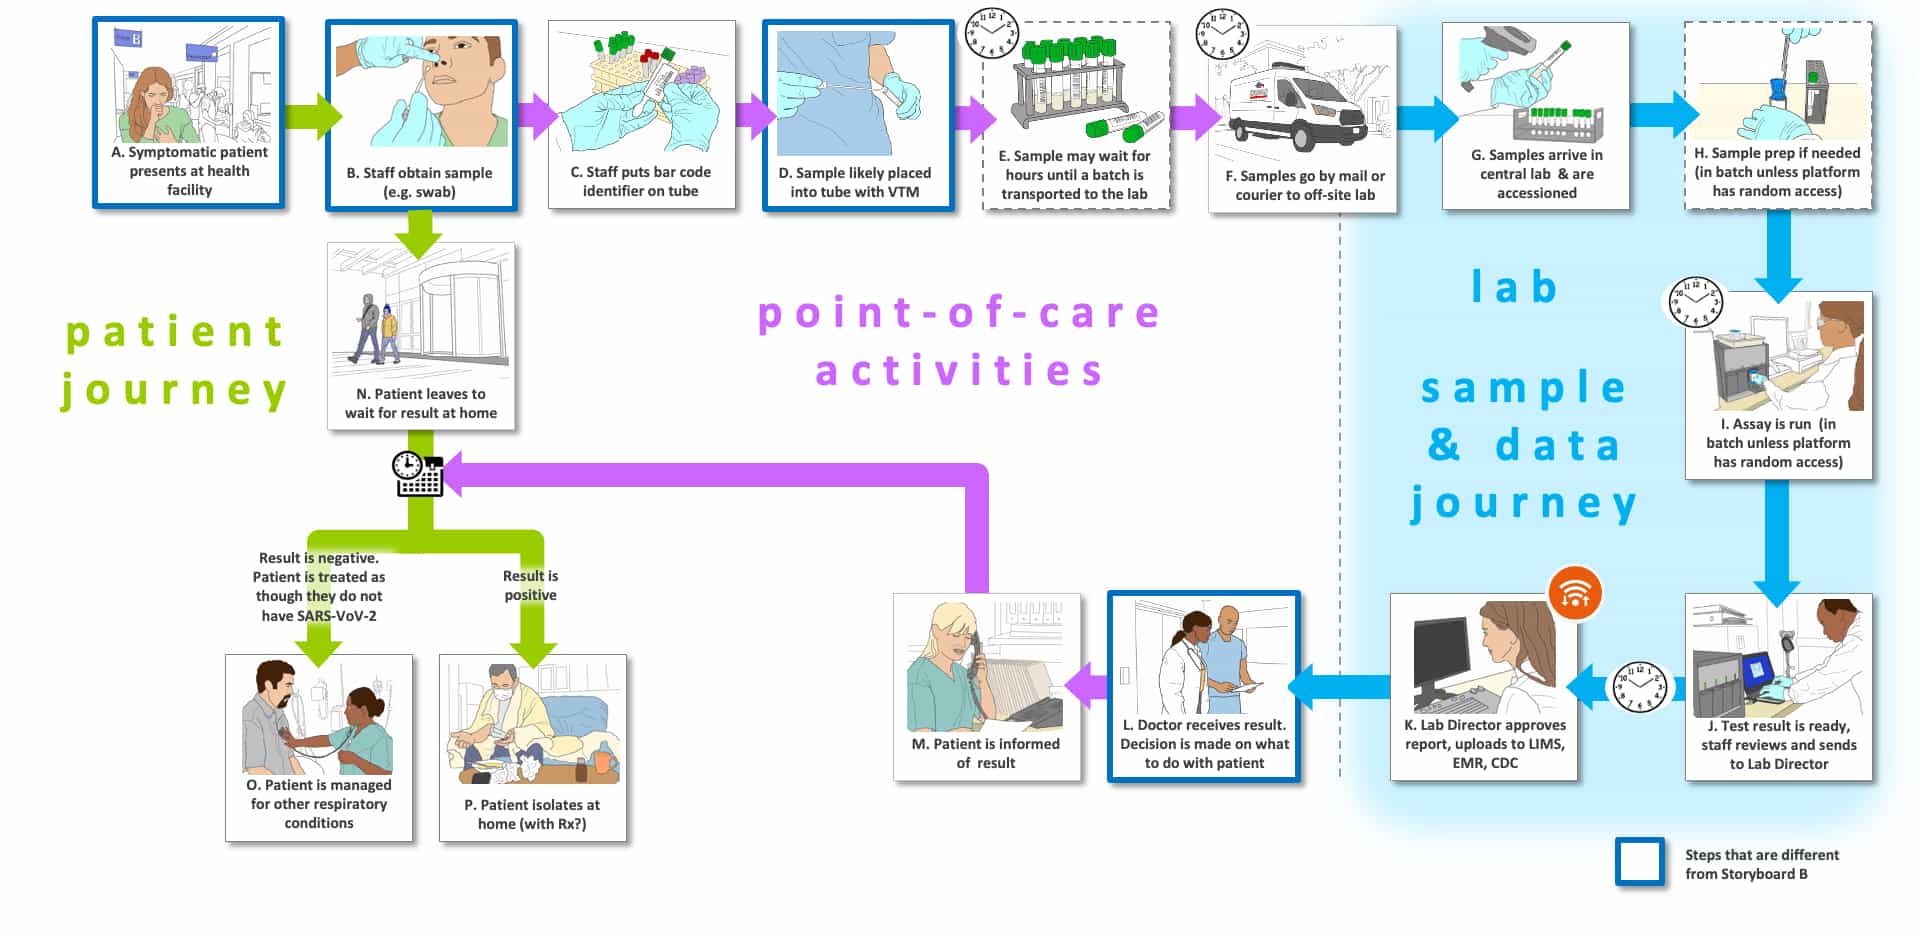
The second Storyboard for Use Case 5 is quite similar to Storyboard B. The significant differences include changes to a number of Steps due to the assumption that in an endemic setting, persons involved in the patient care path will wear less PPE (see Steps B, D and L). This remains to be seen, but we wanted to highlight the issues of potential exposure today. Also, in Step A, the person entering the patient journey is not seeking confirmation testing after a triage test but is encountering their first interaction with the healthcare system to seek true diagnostic testing for SARS-CoV-2.
Send-out testing will be necessary for some time to achieve the testing levels desired. Sample collection, packaging, labeling and shipping are challenging, but the large commercial labs have risen to the challenge. Decentralization to provide logistics as pictured in Storyboard C will supplement the send-out scenario. We believe that Storyboards C and D will be operative for some time to come.
We encourage providers to consider the issues surrounding the decrease in PPE we hope to be required as COVID-19 becomes endemic. For instance, as has already been instituted by some companies, Steps A-E can be replaced by home collection of more convenient samples that are picked up by couriers or shipped by the patient to a lab, as is shown in Storyboard I. Eventually, home testing could replace most of these Steps. However, the performance requirements will be difficult to achieve. Our opinion is that false negative results will be very problematic for many of the testing scenarios that use at-home sample collection processes.
The Storyboards are meant to be approximate descriptions of the overall testing ecosystem. They are organized as flow charts containing sites of activity, people involved (e.g., patients, medical practitioners and laboratorians) and pathways for tested individuals, healthcare professionals (or other testers in some cases), sample collection and transport, testing, result generation and information flow. They also show key decisions informed by the test results.
Steps in this Storyboard that are different from Storyboard B are shown with a thick blue outline.
There are three types of “journeys” in the Storyboards: 1) the tested individual’s (usually patient) journey which are shown using green arrows, 2) point-of-care or point-of-use activities which are shown with purple arrows (e.g., sample collection, sometimes testing) and 3) the sample and data journey through a laboratory, which is shown with blue arrows.
The letters that label each step are not meant to indicate an order for the steps, they are simply there to facilitate discussion about the storyboard. Optional steps have a dashed outline, and examples of possible variations in a step are labeled with the same letter followed by differentiating numbers e.g., B1, B2 and B3)
There are a number of clocks and calendars pictured near specific steps to indicate time-consuming steps and those that could vary in total time depending upon the workflow efficiency of the healthcare site and the characteristics of the testing platform (e.g., batch analysis, time to results).

